Reviews
B2B pipeline demand benchmarks: reading the numbers behind the funnel
Pipeline benchmarks above channel metrics: velocity, coverage, stage conversion, and how to read them against your own CRM history before changing strategy.
What to take away
- Pipeline benchmarks describe flowvelocity, coverage, and stage conversion tell you whether the funnel can fund the quota.
- Channel metrics stop at the lead while pipeline metrics start at the opportunity, so the two views can disagree for a full quarter.
- Coverage and velocity belong in one review, because a full pipeline that ages out looks like a thin pipeline once the slippage lands.
- Your own CRM history is the only fair baseline for stage conversion, since stage definitions and deal mix vary by company.
- The numbers diagnose; the response is a strategy choice about market, message, and channel role.
Why pipeline benchmarks sit above channel metrics
B2B pipeline demand benchmarks are read at the opportunity level, not at the campaign level. That shift in unit is what makes them different from lead reports.
A channel report answers how many leads a program produced and what they cost. A pipeline report answers whether those leads became qualified opportunities, how fast they moved, and whether the total value covers the number.
Stage definitions come first. The standard funnel model separates awareness and evaluation from purchase, and teams that skip that step cannot compare one quarter to the next.
The two views diverge for a simple reason. Cost per lead is measured at the top of the funnel, while pipeline value is measured in the middle. A cheap lead that never qualifies is expensive.
Deciding what to change after the reading is a planning problem, and the B2B marketing strategy page works through market choices, buyer evidence, positioning, and sales alignment.
The four pipeline metrics most teams track
| Metric | Formula | What a move means |
|---|---|---|
| Pipeline velocity | (opportunities x average deal value x win rate) / cycle length | Higher means the same pipeline turns into revenue faster |
| Coverage ratio | open pipeline value / quota target | Lower leaves less cushion against normal slippage |
| Stage conversion | deals reaching the next stage / deals entering the stage | A drop points at qualification or handoff quality |
| Pipeline age | days an opportunity has sat in its current stage | Rising age often shows a stalled deal, not a slow buyer |
Each row answers a different question. Velocity covers speed, coverage covers size, stage conversion covers quality, and age covers momentum. Reading one alone invites a wrong conclusion.
Example: a coverage ratio that hides a velocity problem
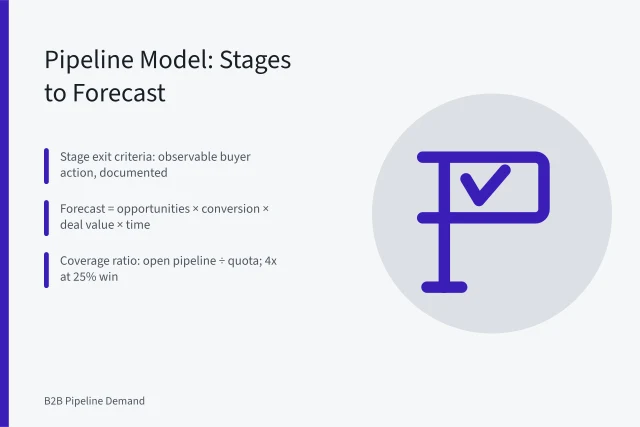
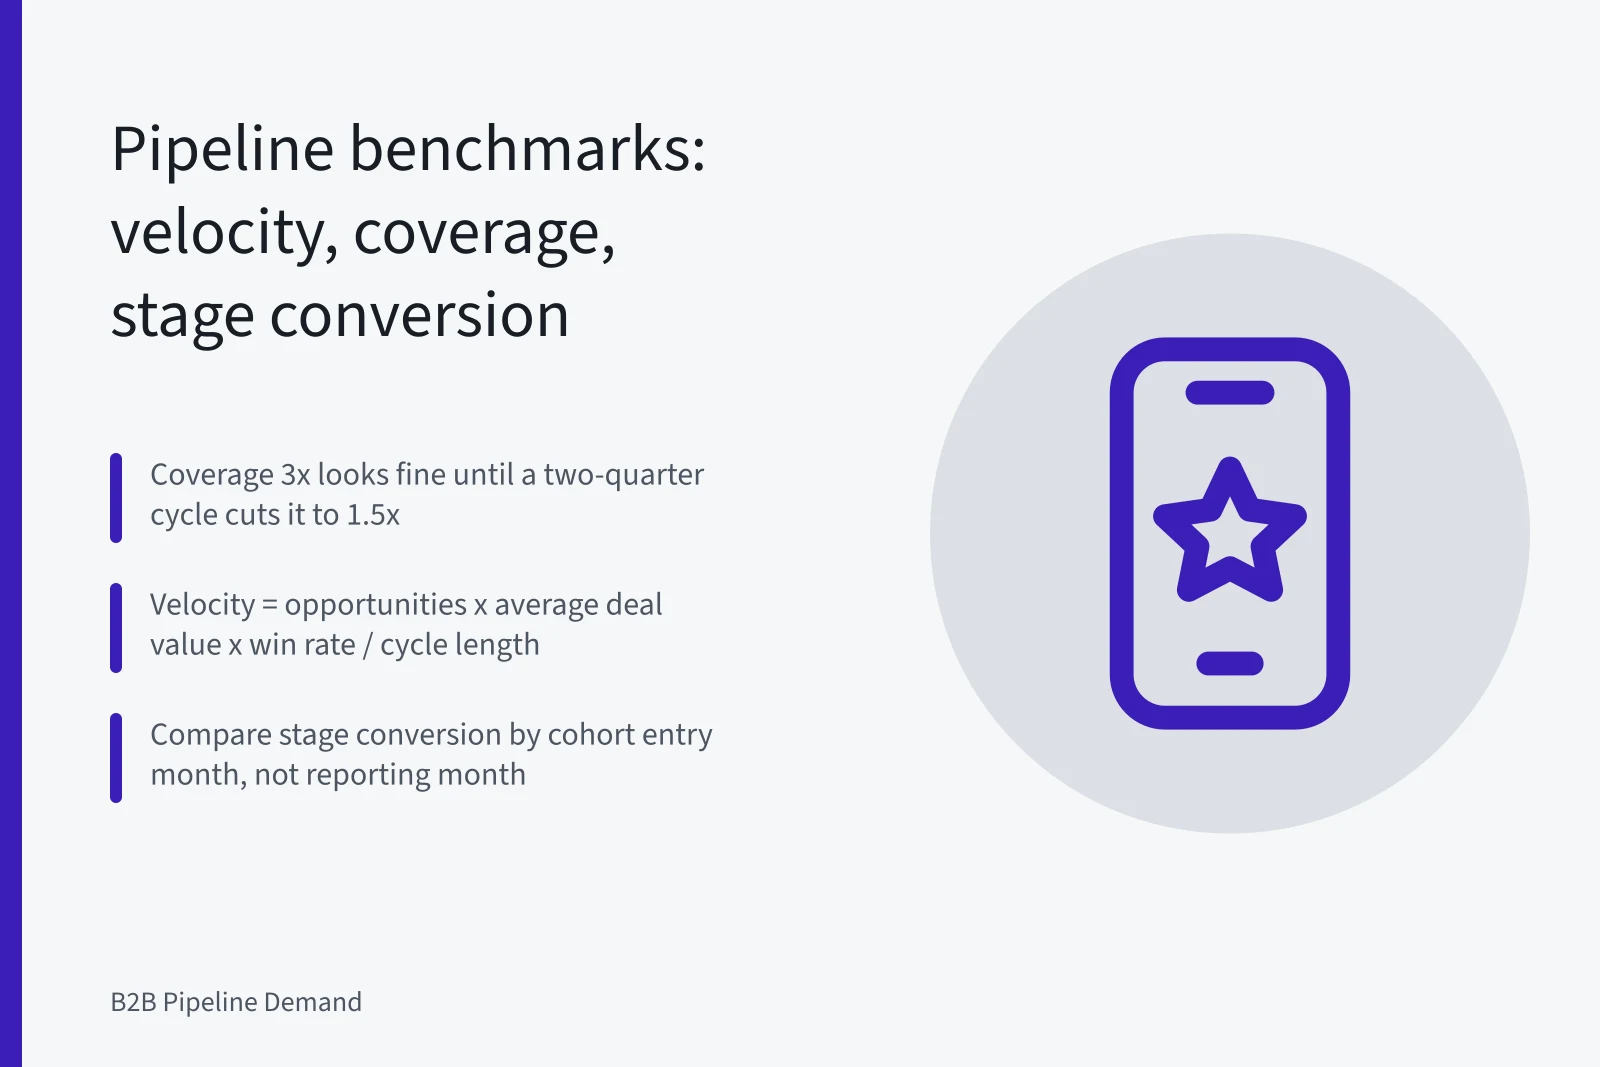
Suppose a team enters a quarter with $3M of open pipeline against a $1M quota. Coverage is 3x, which looks comfortable on a dashboard.
Then the average sales cycle turns out to be two quarters long. Only pipeline created earlier in the year can close inside the period, so usable coverage is nearer 1.5x.
Pipeline velocity makes the same point in one figure: opportunities multiplied by average deal value and win rate, divided by cycle length. Shortening the cycle raises velocity without adding a single lead.
Reading stage conversion without fooling yourself
- Define each stage with exit criteria a new rep would apply the same way.
- Compare conversion by cohort entry month, not by reporting month.
- Split conversion by source, segment, and deal size before blaming a channel.
- Count deals that were recycled backward as their own category.
- Confirm that closed-lost reasons are coded, not typed as free text.
Run the list before drawing a conclusion. Most reported conversion drops trace back to a definition change or a reporting artifact rather than to buyer behavior.
Pipeline velocity benchmarks need your own history
Published averages rarely survive contact with your data. Deal size, segment, and cycle length differ enough that an outside number says more about the sample than about your funnel.
Public filings offer a partial comparison for listed competitors. Sales and marketing expense lines appear in annual reports, and the SEC EDGAR company search returns them by company name.
Intent data and lead scoring raise a second concern. Contact records and behavioral signals are personal information, and the NIST Privacy Framework gives teams a structured way to assess that risk before scoring models go live.
A benchmark is only useful when the definition behind it matches the definition you report against. Otherwise it measures someone else's funnel.