Rules
Part of How B2B content marketing works for a business team
Reading B2B content marketing benchmarks without fooling yourself
Content marketing benchmarks mislead unless you first fix the sample, the denominator and the content job before comparing any two numbers or vendor reports.
What to take away
- A benchmark is a denominator plus a content job. Fix both before you compare anything.
- Search Console hides anonymized queries and truncates rows, so its totals never match your analytics.
- Build six internal rungs: quality, production, reach, use, progress, durability.
- Report a range with its sample size, not a single number with a target attached.
- When a definition changes, restate the prior period or mark the break.
What the platform will not show you
Google's Search Console documentation states that anonymized queries are omitted from the query report, and that rows can be truncated. Privacy-protected queries can still appear in chart totals. So the query table and the total above it will disagree, and neither is wrong.
Save the filters, date range, property scope and export behind every comparison you keep. A screenshot of a chart is not a benchmark. The B2B content marketing checklist covers what to record alongside the export.
Site analytics, your CRM and finance use different scopes and identity rules. Settle those differences first, then pick a number. There is no universal content return figure, and anyone quoting one has hidden a scope decision.
Build the ladder
Six rungs, each with its own denominator.
- Quality: factual correction rate, source completeness, expert review completion, reader task success.
- Production: research, draft, approval, publication, distribution and refresh time, plus fully loaded cost by content type.
- Reach: intended-account or role reach, search impressions, email delivery, event attendance.
- Use: qualified reading, repeat visits, tool completion, subscriptions, sales use, customer use.
- Progress: verified account action, opportunity movement, retention, expansion, revenue evidence by comparable cohort.
- Durability: content still accurate, useful, discoverable and commercially relevant at six and twelve months.
Each rung needs a denominator you can restate. "Qualified reading" means nothing until you say qualified by what.
Worked example: a reach number that moved
Suppose last quarter's search impressions ran at 40,000 and this quarter's at 62,000. Before you call that growth, check three things.
- Did the property scope change, for example a new subdomain or a domain property replacing a URL prefix?
- Did the date range shift by a week, pulling in a seasonal spike?
- Did the anonymized-query share change, which moves the visible rows without moving demand?
If all three hold steady, the 22,000 difference is a real movement in the same measurement. If any one changed, you have two numbers from two measurements, and the honest move is to restate the earlier period or label the break.
Set planning ranges, not targets
For each content job, use comparable recent cohorts to set a baseline, an expected band, an upside and a downside. Record the sample size, the season, how mature the content is, any paid support behind it, and the exclusions you applied.
Assign an action threshold and an owner to each range. A range nobody acts on is a report, not a benchmark.
Make the comparison reproducible
The GAO evaluation design guide ties evaluation questions to evidence needs and design choices. Federal evaluation guidance does not make a local marketing result transferable, but the discipline does. Understanding how B2B content marketing works for a business team starts with the same discipline: naming the population, the content job and the decision before any number is compared.
The NIST experimental design selection guidance starts design choice with the objective and the practical constraints. That is the line between reporting a benchmark and claiming an effect.
Content benchmark ladder
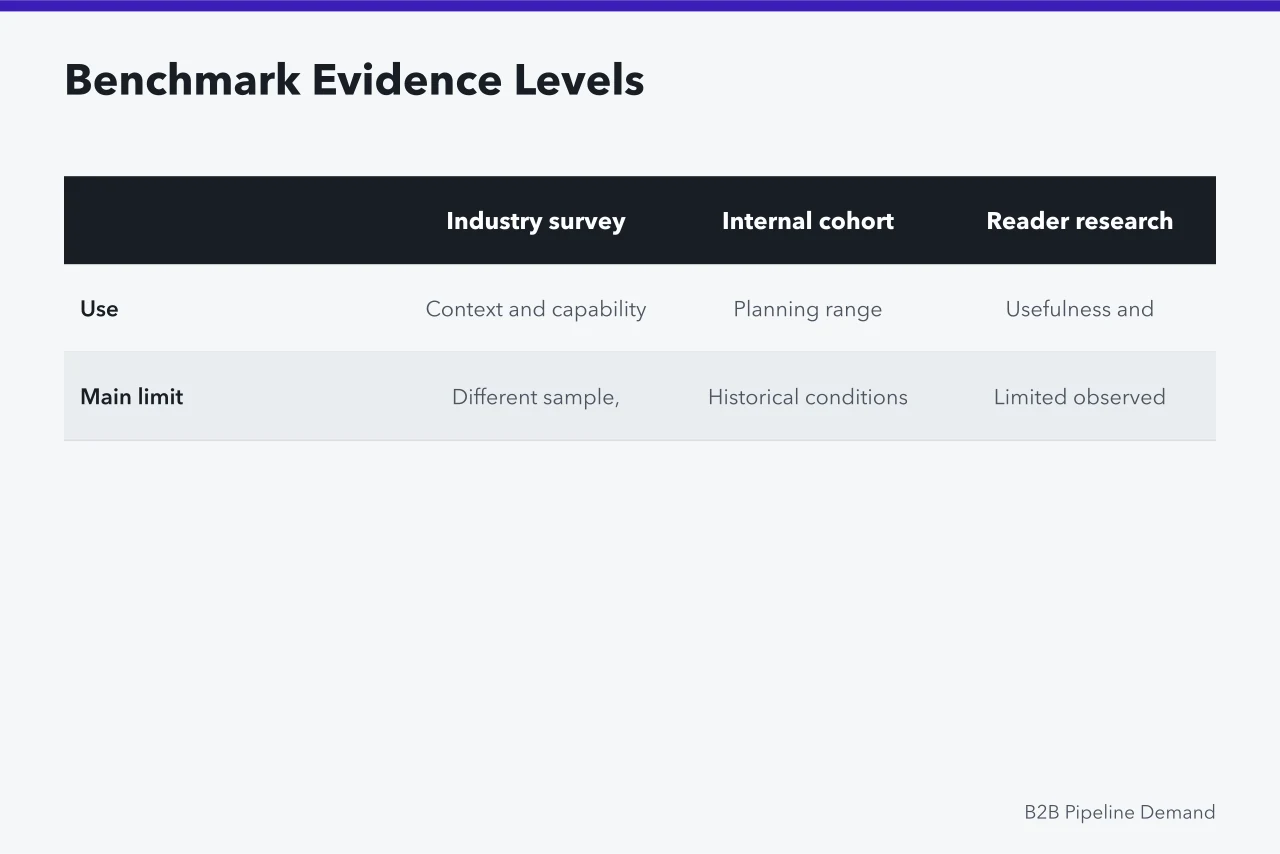
| Level | Use | Main limit |
|---|---|---|
| Industry survey | Context and capability questions | Different sample, self-reported |
| Internal cohort | Planning range | Historical conditions |
| Reader research | Usefulness and barriers | Small observed population |
| Controlled test | Decision evidence | Bounded treatment and period |
Common questions
What makes a content benchmark usable?
It names the population, the content job, the denominator and the period. It also states the source and the decision it feeds. A stable internal cohort usually beats a broad average.
Can an industry percentage become a target?
Not on its own. A target has to fit your audience, economics, capacity, distribution, data quality and current baseline. Treat the published figure as a question, not a quota.
How do I handle a change in definition?
Version the definition, document the break and restate prior periods where you can. Never present incompatible periods as one continuous trend. The B2B content marketing examples show how teams label those breaks in practice.
Why do my own tools disagree?
Search Console, site analytics, the CRM and finance each count different things under different identity rules. Pick one system as the source for each metric and say so. Where two systems must agree, reconcile the scope first.