Reviews
A pipeline model for B2B demand: turning stage definitions into forecasts
How to build a B2B pipeline demand model: stage exit criteria, CRM conversion rates, coverage ratio and velocity math that turns stage definitions into a forecast.
What to take away
- A B2B pipeline demand model has three linked partsstage definitions with exit criteria, conversion rates rebuilt from your own CRM, and a forecast formula that multiplies the two.
- Stage definitions carry the forecast. If two people disagree about whether a deal sits in stage three, the conversion rate for stage three is noise.
- Coverage ratio, sales velocity and stage conversion are the three checks to run before changing strategy.
- Refresh conversion rates quarterly from closed-won and closed-lost cohorts, and hold the definitions fixed between refreshes.
Stage definitions as forecast inputs
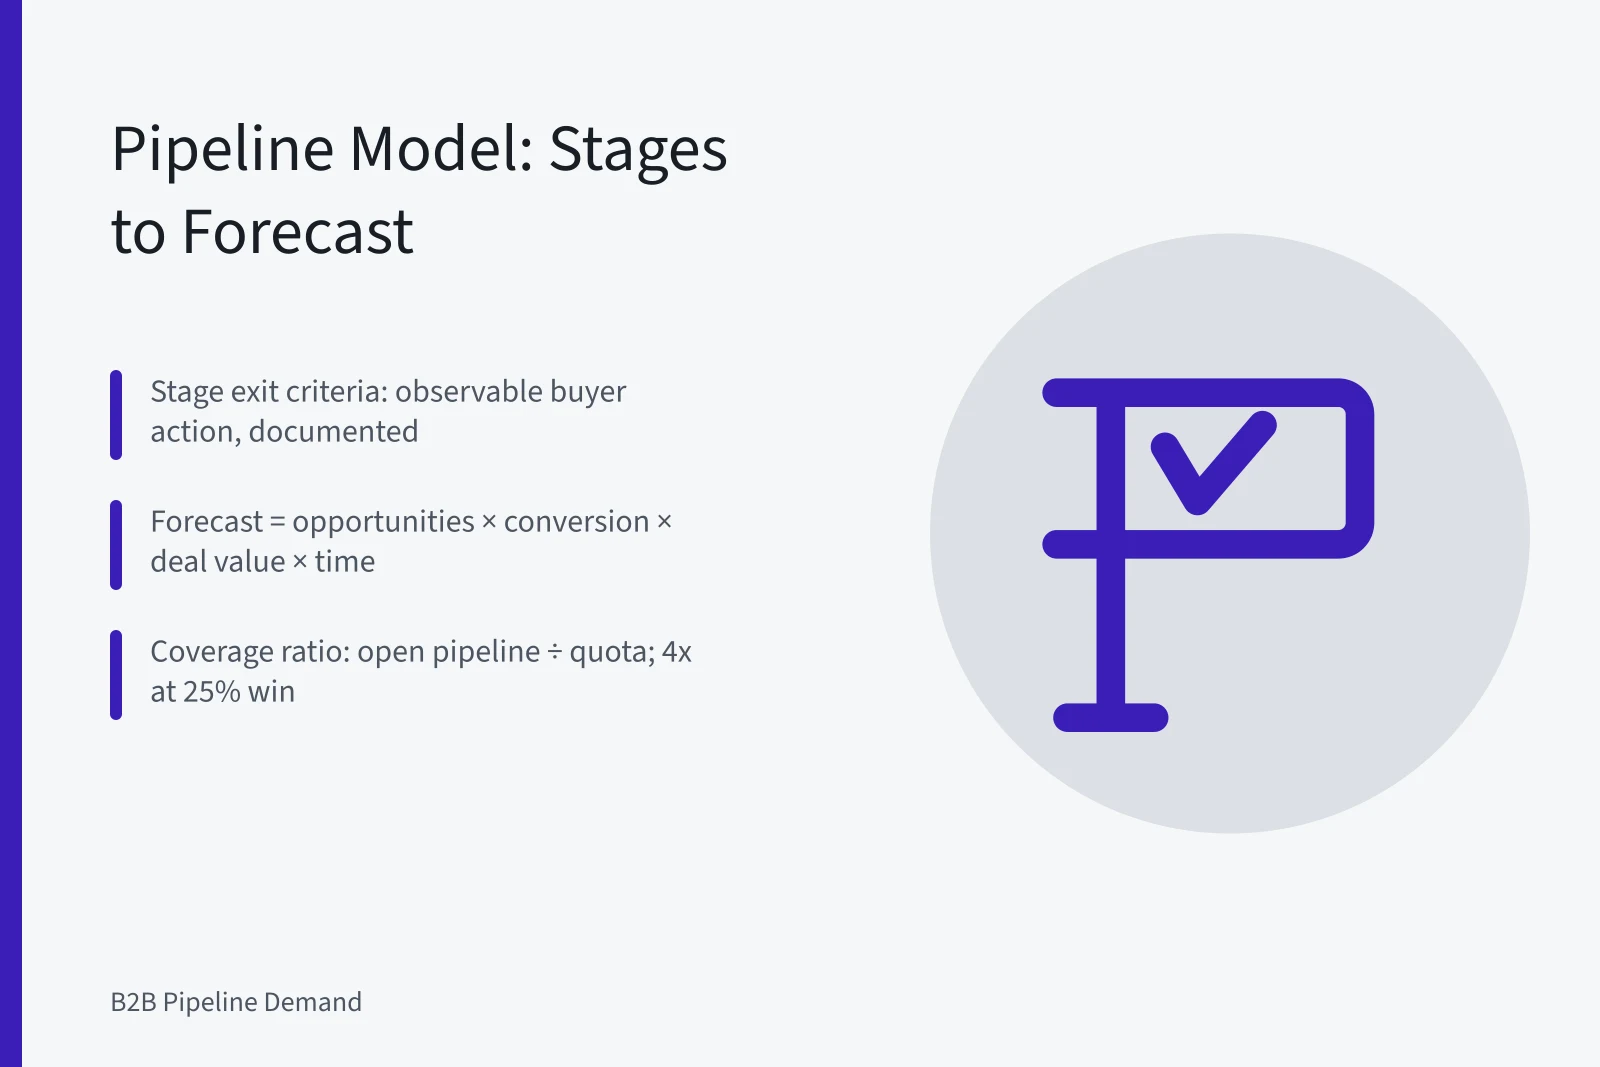
Define every B2B pipeline stage by an observable buyer action plus a documented exit criterion. "Engaged" is a feeling. "Security review scheduled" is an event you can count and date.
The conventional ordering runs from awareness to purchase, and the sales funnel article is a reasonable reference for naming stages in sequence.
Write the definitions into one document and name the CRM field that triggers each transition. That artifact makes pipeline forecasting repeatable across reps and quarters.
Record stage age as well. A deal sitting in stage three for twice the median deserves a review, not another roll-up.
Forecast math for a period
Forecast equals opportunities in a stage times that stage to close rate times average deal value times a time adjustment.
The time adjustment reflects how much of the cycle lands inside the period. A deal 15 days from close counts fully. A deal 90 days out counts partly or not at all.
| Stage | Exit criterion | Conversion to closed won | Median days to close |
|---|---|---|---|
| 1 Discovery | Pain confirmed by economic buyer | 8% | 110 |
| 2 Solution fit | Technical requirements signed off | 22% | 74 |
| 3 Validation | Security and legal review scheduled | 45% | 31 |
| 4 Procurement | Signed order form received | 82% | 9 |
Build rates like these from your own CRM, not from a vendor slide. Split cohorts by segment, source and rep tenure before trusting a blended number. One blend that mixes a six month enterprise cycle with a 20 day self-serve deal hides both.
Coverage ratio and sales velocity
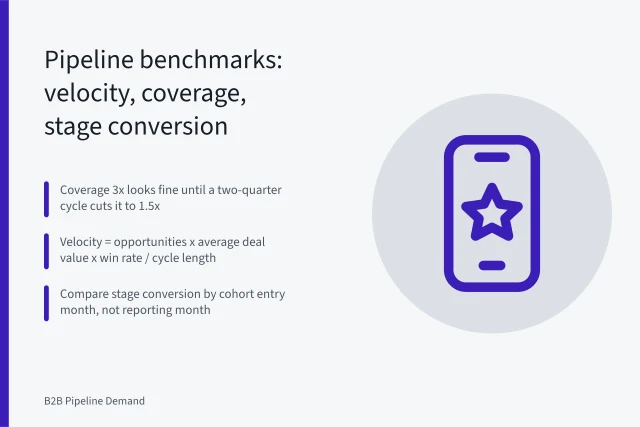
Coverage ratio is open pipeline value divided by the quota for the period. Derive the target from your own win rate instead of a generic figure. At a 25 percent win rate, four times coverage is a floor, not a stretch target.
Sales velocity is the second check: opportunities times average deal value times win rate, divided by cycle length. If velocity is flat while spend climbs, the constraint sits in conversion or cycle time, not lead volume.
A stage without an exit criterion is a label, not a forecast input.
Example: a 120-day security software cycle
These numbers are illustrative and show the arithmetic only.
Suppose a team holds 40 opportunities in stage 2 at a 22 percent conversion rate and an average deal value of $18,000. Expected value from that cohort is about $158,000.
If the quarter's quota gap is $400,000, the team needs more stage 2 or stage 3 inventory. The model points to the stage, not to the marketing budget.
Re-sort the same cohort by source. Referral-sourced deals may convert well above the blend, which changes where B2B demand planning effort belongs.
Benchmark checks before a strategy change
Pipeline benchmarks sit above channel metrics. Stage conversion, velocity and coverage show whether a problem is volume, quality or cycle length.
Reading those numbers against your own CRM history first, in the guide to reading the numbers behind the funnel, stops a team from rebuilding a funnel that already works.
Regional and legal inputs to the model
The same skeleton adjusts for region and sector. Northeastern professional services firms build seasonality-aware models with regional coverage ratios, referral sourcing and client-mix stress tests, because their demand peaks follow budget and audit calendars rather than fiscal quarters.
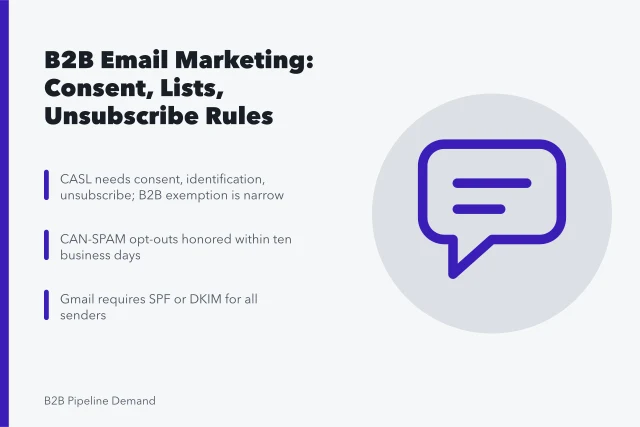
In Canada, PIPEDA and CASL shape how contact data enters the funnel, so consent status belongs inside the stage model. Intent data and lead scoring need their own privacy controls, and the NIST Privacy Framework offers a structure for managing that risk.
In the United States, SEC EDGAR filings disclose sales and marketing expense at public companies, which gives a rough check on spend per opportunity.