Reviews
A pipeline model for Northeastern professional services firms
How Northeastern professional services firms build seasonality-aware pipeline models with regional coverage ratios, referral sourcing and client-mix stress tests.
What to take away
- A Northeastern pipeline model starts from regional client mix, not from a national conversion rate borrowed from software.
- Referral and association sourcing fills more early stage pipeline here than paid digital does, so stage weights should reflect that.
- Seasonality is uneventax season, construction season, summer vacation weeks and Q4 budget flushes pull deal timing in different directions.
- Coverage ratios belong to segments, not to the whole firm, and need a quarterly re-test against stage aging.
Why Northeastern pipeline math differs
National benchmarks blend industries that do not share a buying calendar. A firm selling audit work in Boston, design services in Portland and litigation support in Manhattan faces three different demand curves. Those curves decide when a proposal actually closes and how much pipeline must be open in any month.
The buyer profile is distinct too. Insurance carriers in Hartford, hospital systems along the I-95 corridor and university endowments across New England run procurement cycles tied to fiscal years starting in July, October or January. One blended conversion rate hides all three cycles.
Stage definitions and confidence levels
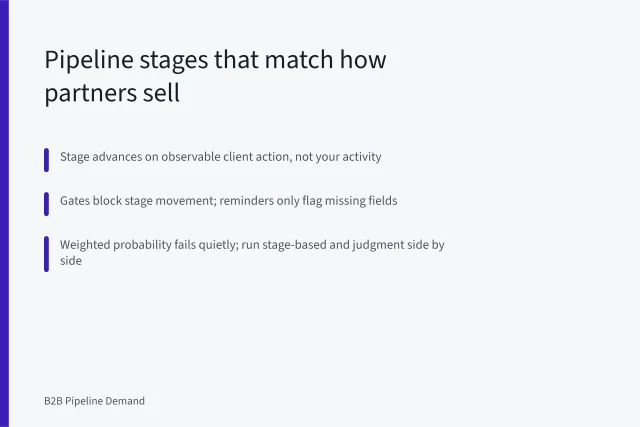
A stage is useful only when two partners look at the same deal and agree where it sits. Write evidence rules, not adjectives.
| Stage | Evidence required | Confidence weight |
|---|---|---|
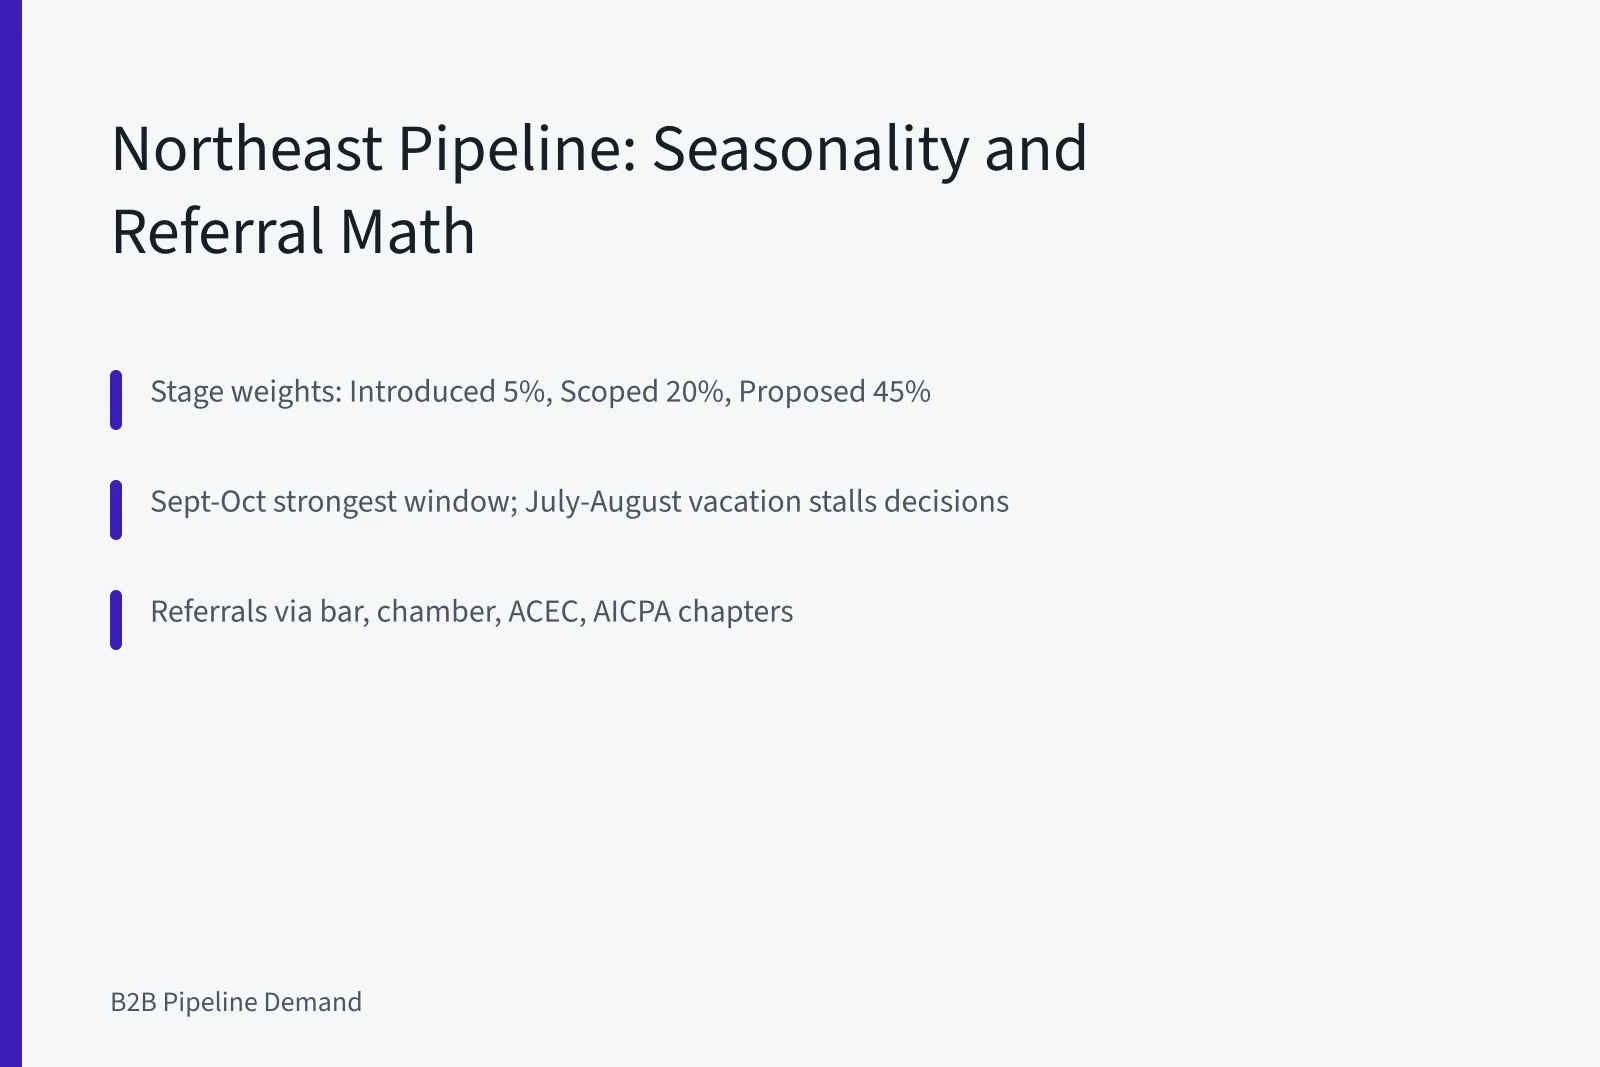
| Introduced | Named referral source and a dated first meeting | 5 percent |
| Scoped | Written problem statement and named budget owner | 20 percent |
| Proposed | Fee proposal delivered and reviewed with the buyer | 45 percent |
| Verbal | Buyer states intent and terms are under review | 70 percent |
| Signed | Engagement letter executed | 100 percent |
Stage names vary by firm, but the underlying progression is well documented; the Wikipedia sales funnel entry describes the standard conversion logic.
A seasonality map for Northeast demand
- January to Apriltax and audit work peaks, so new consulting conversations slow.
- May to Junebuyers build budgets for July fiscal years, and proposal volume rises.
- July to Augustvacation weeks in New England and Quebec push decision meetings into September.
- September to Octoberthe strongest new business window before the holidays.
- November to Decembersome buyers spend what remains, others freeze until January.
Sourcing mix in a referral-heavy market
Referrals carry more pipeline in this region than most national models assume. Bar associations, chambers of commerce, alumni groups and trade bodies such as ACEC and AICPA chapters feed introductions that never appear in paid channel reporting.
Track referral sources in the CRM the same way you track campaigns, or the sourcing mix stays invisible. A banker, an insurance broker or a former client is a channel, and each deserves its own conversion rate.
If you market into Canada, consent rules apply to commercial email. The official CASL portal sets out the requirements for sending to Canadian prospects.
Coverage ratios by client mix
Set coverage as a multiple of the next quarter's target, then vary it by segment. Retainer and compliance work renews more predictably, so it can carry a lower multiple than competitive project work that runs through formal procurement.
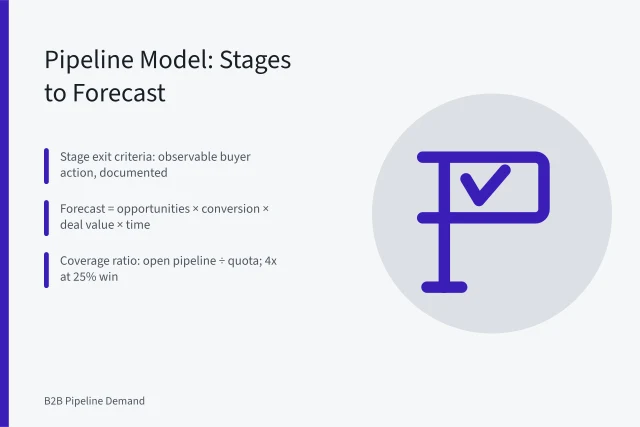
Many partnerships open planning with a rough 3 to 1 coverage convention. Treat it as a guess. Replace it with your own close rates by stage once you have four quarters of data.
Before sizing anything, count the firms you compete with. Provincial registries such as the Ontario Business Registry list incorporated entities, which gives a firmer denominator than a vendor estimate.
Example: two client segments, one pipeline
Take a firm with a compliance line serving insurance clients and a project line serving hospital systems. The compliance line might close most proposals within 90 days. The project line might close a quarter of them across two budget cycles.
If both lines carry the same target, the model needs far more weighted pipeline in the project line. Splitting targets by segment shows that need before the quarter starts, not after it ends.
Building the model in six steps
- Split the book by client type and set a separate quarterly target for each segment.
- Write stage definitions with evidence rules that two partners can apply the same way.
- Assign confidence weights so weighted pipeline replaces gut feel in the forecast.
- Overlay the regional calendar to find the months when conversion drops.
- Set coverage multiples per segment from your own closed-won history.
- Review stage aging weekly and close out deals that have not advanced in 30 days.
Stress-testing the model you already run
A Northeastern professional services pipeline model holds up only when its stages, gates and confidence levels match how partners actually sell. If your current model uses stages that no partner can define, the forecast error sits in the definitions, not the market.
Run a seasonality audit next. Compare close rates by month for the last two years and mark the months that consistently underperform. If August and December are weak, stop forecasting new business in them.
Finally, test client mix drift. When one segment grows past a third of revenue, its buying cycle starts to dominate the blended numbers and the old coverage ratio stops working.