Strategy
Does your Northeastern professional services pipeline model hold up?
A pipeline model for Northeastern professional services firms holds up only when its stages, gates and confidence levels match how partners actually sell.
What to take away
- A pipeline model predicts three things: revenue timing, resource demand and pursuit risk. Revenue alone is half a model.
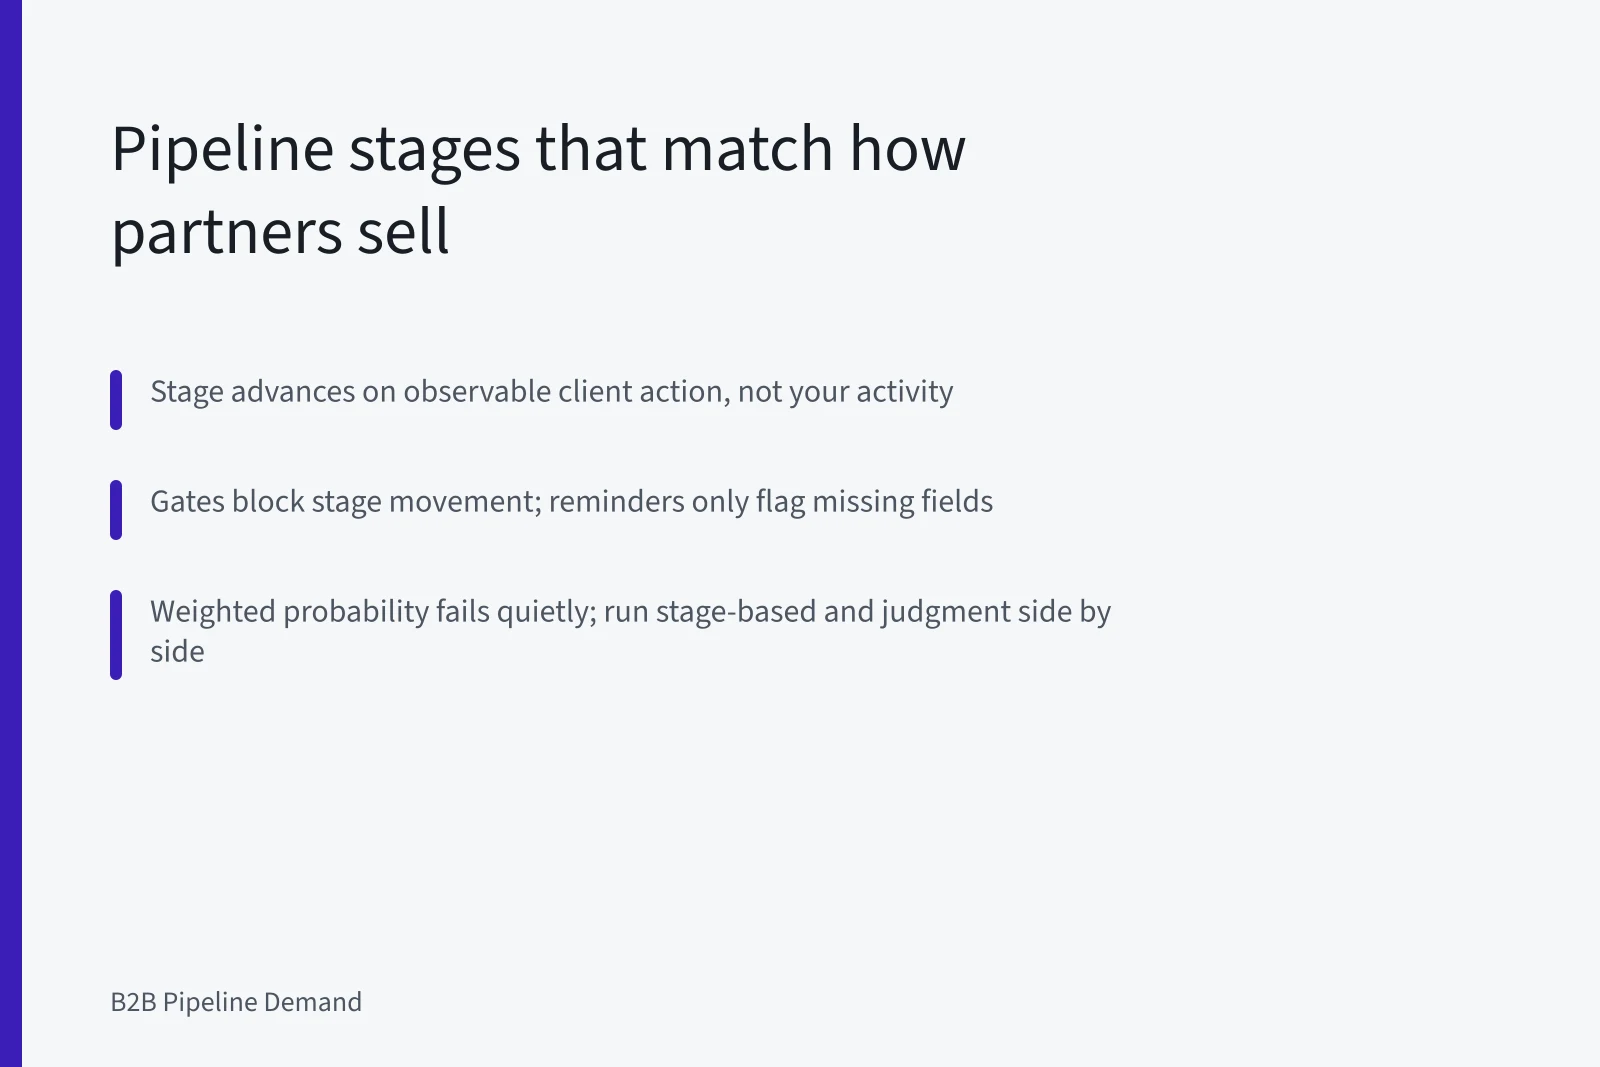
- A stage should advance on observable client action, not on your own activity. Sending a proposal is your move; the client agreeing to read it is theirs.
- Hygiene rules work as gates that block stage advancement, not as reminders that flag a missing field after the fact.
- Set stage confidence from your own closed and lost work. Vendor defaults and round numbers overstate the middle stages.
- Days since last client contact predicts loss earlier than pipeline value or win rate, and it takes seconds to review.
What the model has to predict
A pipeline model answers one question: what work will the firm sell, to whom, and when? In the Northeast, that question has a specific shape.
Law, accounting and consulting firms here sell through partners who own the client relationship. The buying calendar differs by city.
New York banks and law firms follow Wall Street deal cycles, and many commercial insurance policies renew on January 1. Boston and Cambridge follow life sciences funding and university budget years.
Hartford runs on insurance renewal dates. Philadelphia runs on hospital and university procurement.
The region is not one market. Hartford and Newark carry insurance. Boston and Greenwich carry asset management. Cambridge and New Jersey carry life sciences. Groton carries defense shipbuilding. Boston, New York and Philadelphia carry large hospital and university systems. Each buys on its own calendar and writes contracts in its own style.
Treat sector as a first-class field, not a tag. Sector drives cycle length, decision unit, and the evidence a buyer needs before signing. The business development ops case study shows what changes when it does.
Staffing arguments need outside numbers. The U.S. Bureau of Labor Statistics publishes business leader resources for benchmarking headcount and hiring plans against national data. Use those figures when you ask for more business development headcount.
Stages that describe a relationship, not a transaction
Most firms inherit a generic template: lead, qualified, proposal, negotiation, closed. Those stages describe a transaction, not a professional services relationship. Replace them.
A stage should change only when the client does something observable. Sending a proposal is your activity. The client agreeing to review it with a named person by a named date is theirs.
A workable set for the Northeast:
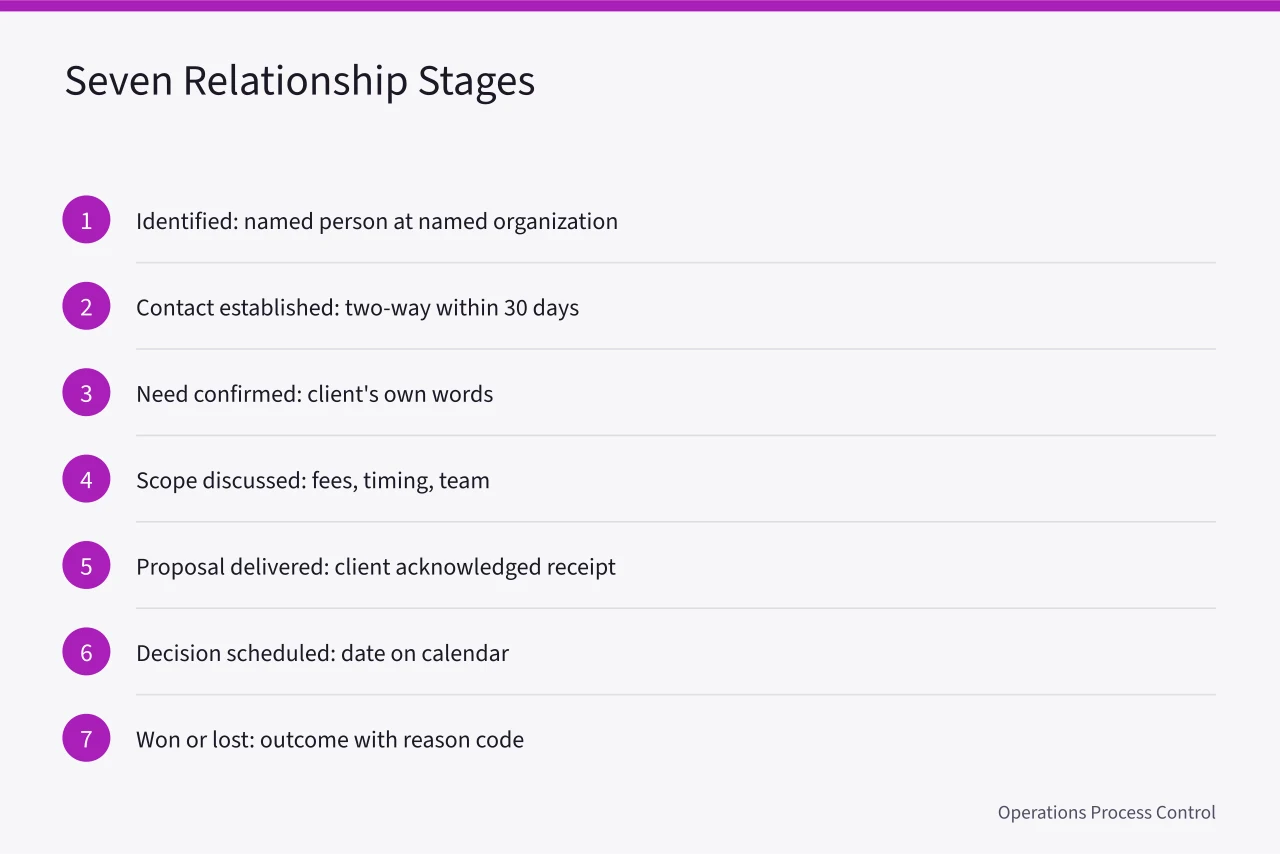
Law firms often stall at stage three for months, waiting for a matter to appear. Accounting firms push to stage five before the client has budget. Consulting firms reach stage six without confirming scope. Each pattern distorts the forecast in its own direction.
Stage definitions must name the evidence required. "Need confirmed" with no written note is an opinion. A short CRM note holding the client's own words is evidence. What the stages produce depends on the data model underneath them, which is why tool choice comes second.
Gates, not reminders
A reminder tells a partner to fill a field. A gate stops the deal from moving until the field exists. Only gates change behavior.
Required fields belong to a stage, not to the record. A deal at stage two does not need a fee estimate. A deal at stage five should not exist without one.
- Client contact name and role recorded
- Next step described in one sentence
- Next step date on the calendar
- Estimated fee range recorded
- Decision maker identified
- Source of the opportunity recorded
- Last client contact within 30 days
Add sector and service line as required at creation. Add competitor presence at stage four. Add decision criteria at stage five.
Contact gaps bite hardest where budget calendars close. Medicare's fiscal year starts October 1, New York State's starts April 1, and Massachusetts starts July 1. August vacations and the December holidays stall decisions across the region. A deal with no client contact in 45 days is not a deal.
Configure validation rules so the record cannot save without the fields. If the CRM allows a stage jump, partners will jump. Exceptions need a path: a partner who genuinely cannot fill a field records why, with a date to revisit.
Client contact data belongs in the CRM, not in personal inboxes. The Federal Trade Commission publishes compliance guidance for business operations that covers how client data must be handled.
Three forecast models and how partners break them
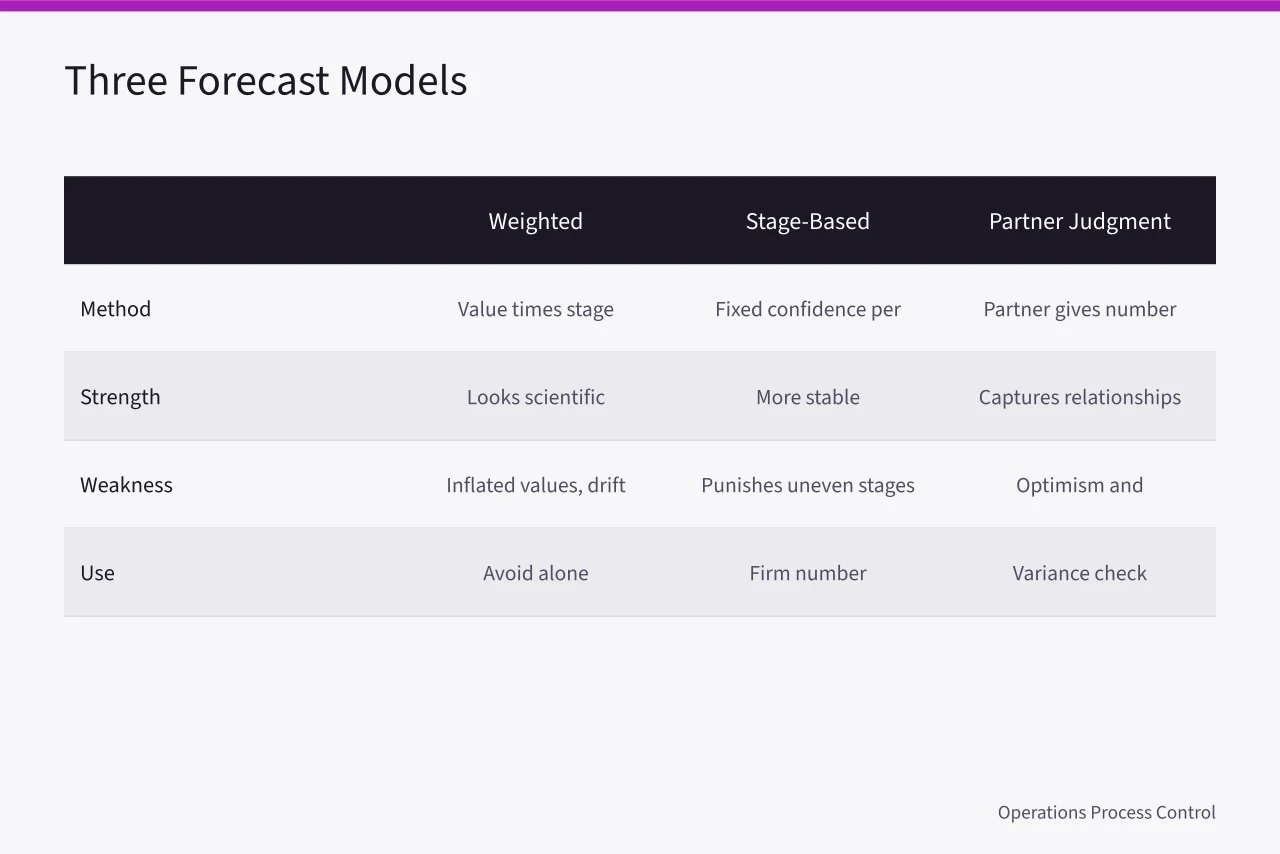
Weighted probability multiplies deal value by a stage percentage. It looks scientific and fails quietly, because partners inflate values, stages drift, and the percentages were guesses from the start.
Stage-based commitment assigns fixed confidence to each stage. It is more stable, but it punishes firms whose stages are unevenly defined.
Bottom-up judgment asks each partner for a number. It captures relationship knowledge and invites optimism and sandbagging in equal measure.
Run two models side by side: a stage-based model for the firm number and partner judgment for the variance. When the two diverge by more than 15 percent, investigate before you publish.
Partner behavior breaks models in predictable ways. Partners create deals late to avoid scrutiny. They park deals at stage four because moving them invites questions. They record large values with no fee evidence. They code losses as "no decision" to avoid blame.
Each has a countermeasure. Late creation is fixed by requiring source and first contact date. Stage stagnation is fixed by aging reports. Value inflation is fixed by fee range evidence. Loss coding is fixed by a short list of reason codes and a monthly review.
Labor market shifts move forecasts too. The Monthly Labor Review publishes analysis that connects hiring and wage trends to client demand. When clients freeze hiring, advisory work often follows.
Worked example: testing the model against last year
A pipeline model is a hypothesis. Test it against last year's outcomes before you trust it for next year's forecast.
Pull every deal closed or lost in the last 12 months. For each, record the stage it reached, the days spent in each stage, the final value, and the outcome. Then compare.
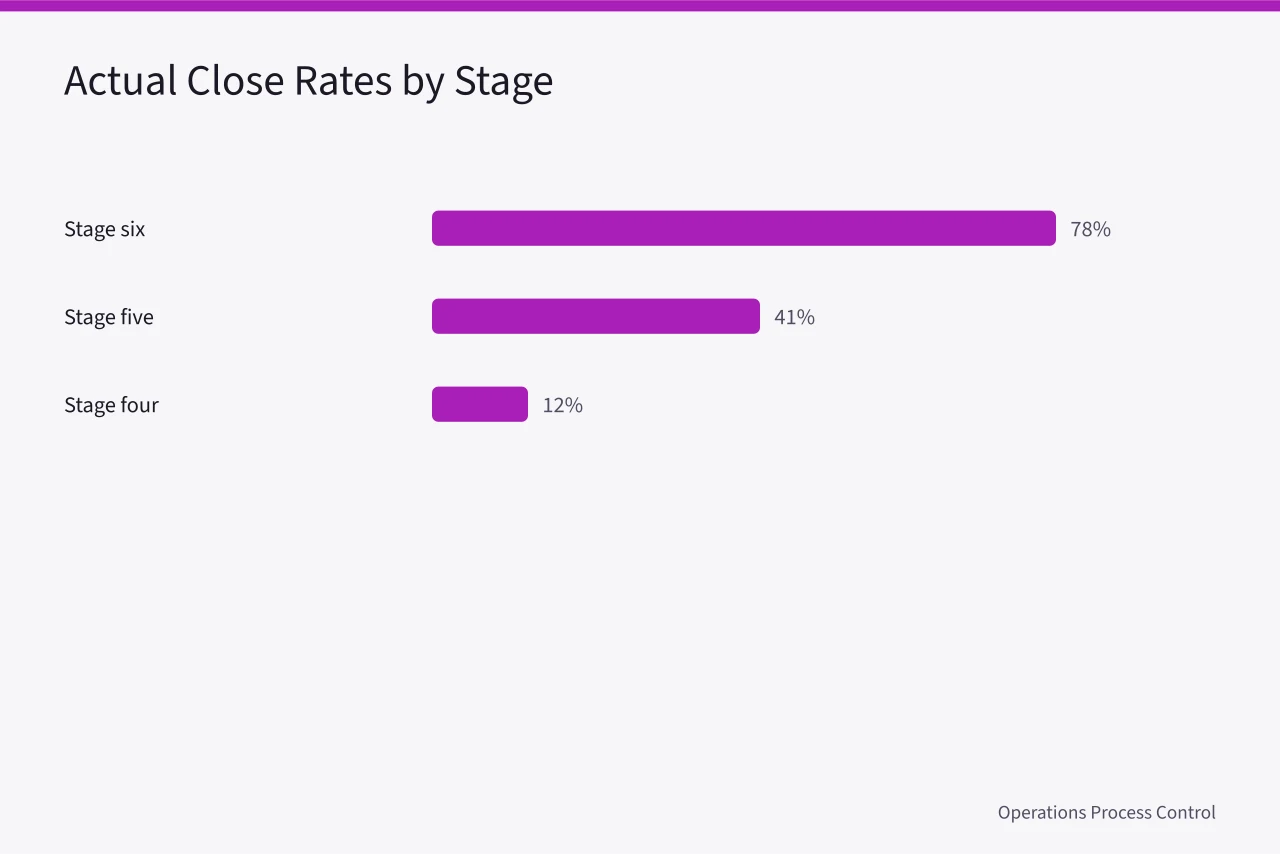
A Boston consulting firm reviewed 120 deals. Deals that reached stage six closed 78 percent of the time. Deals that reached stage five closed 41 percent. Deals at stage four closed 12 percent. The firm's old model used 90, 60 and 30 percent, overstating stage five by 19 points.
The firm reset stage five confidence to 40 percent and stage four to 10 percent. Forecast error for the next quarter fell from 22 percent to 9 percent. No new tool was purchased.
Run the same test by sector. If financial services deals close much faster than health care deals, forecast by sector rather than in aggregate.
Run it by partner too, carefully. A partner closing 70 percent at stage five deserves a different weight than one closing 20 percent. Use the data to coach. The BLS glossary of labor terms defines establishment and industry in ways that keep your sector comparisons consistent with national data.
Metrics that show a deal dying while there is still time
Pipeline value and win rate are both lagging. Add measures that show trouble earlier.
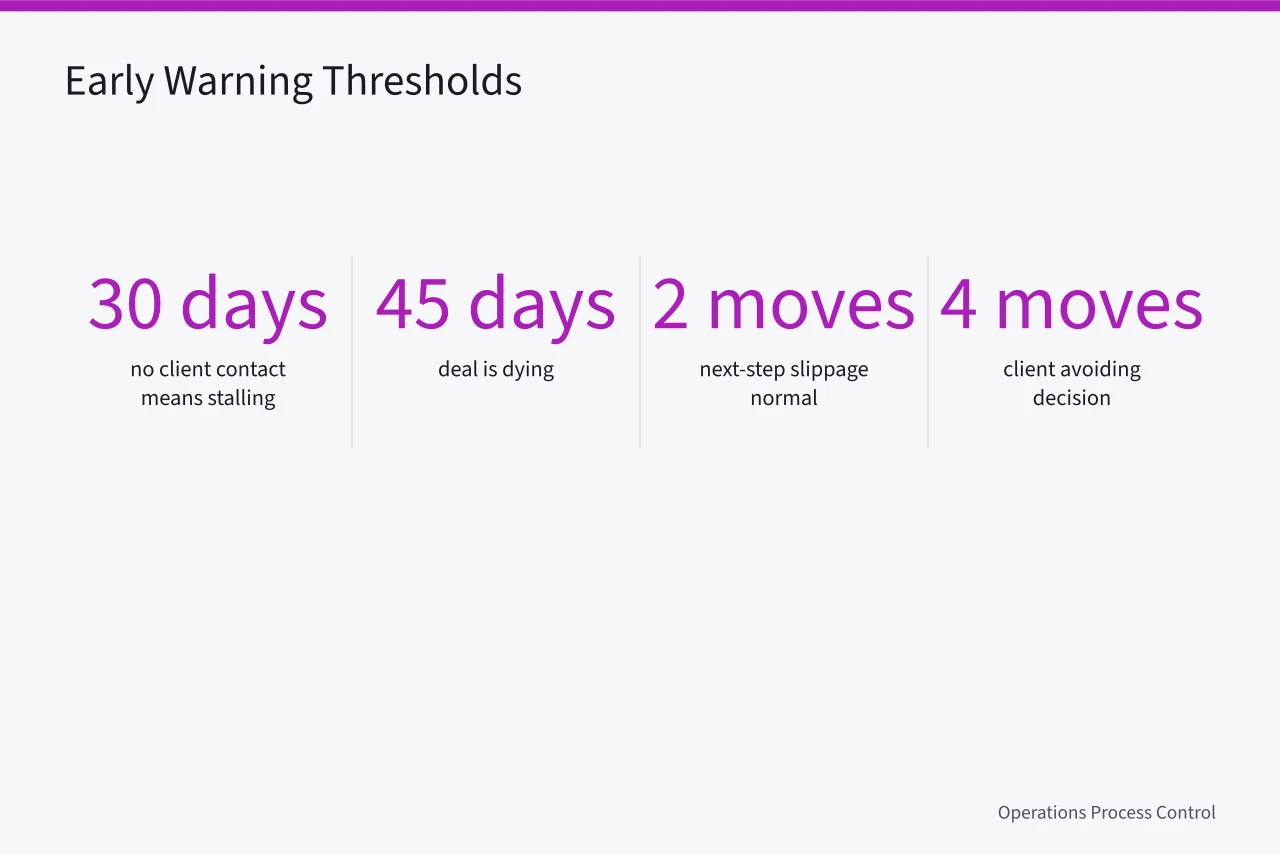
Days since last client contact is the best single early warning. No client touch in 30 days means stalling. At 45 days, the deal is dying.
Stage aging is second. If the median deal spends 20 days at stage four and yours has spent 60, something is wrong. Compare each deal to the median for its stage and sector.
Next-step slippage counts how many times a next step date has moved. Two moves are normal. Four mean the client is avoiding a decision.
Buyer engagement breadth measures how many people at the client have spoken with the firm. One contact is fragile. Three contacts across two functions is durable.
Proposal-to-decision time shows how long the client takes after receiving a document. A lengthening trend across deals signals a market shift, not a partner problem.
Source quality tracks which sources produce deals that close. In the Northeast, referral sources often outperform event sources. Fund the ones that close.
These belong in a weekly review, not a quarterly report. Business development ops staff should walk them with partners and ask the kind that reveal a dying deal before the deal is lost.
Rebuilding inside the CRM you already own
Partners resist new systems. They do not resist better questions.
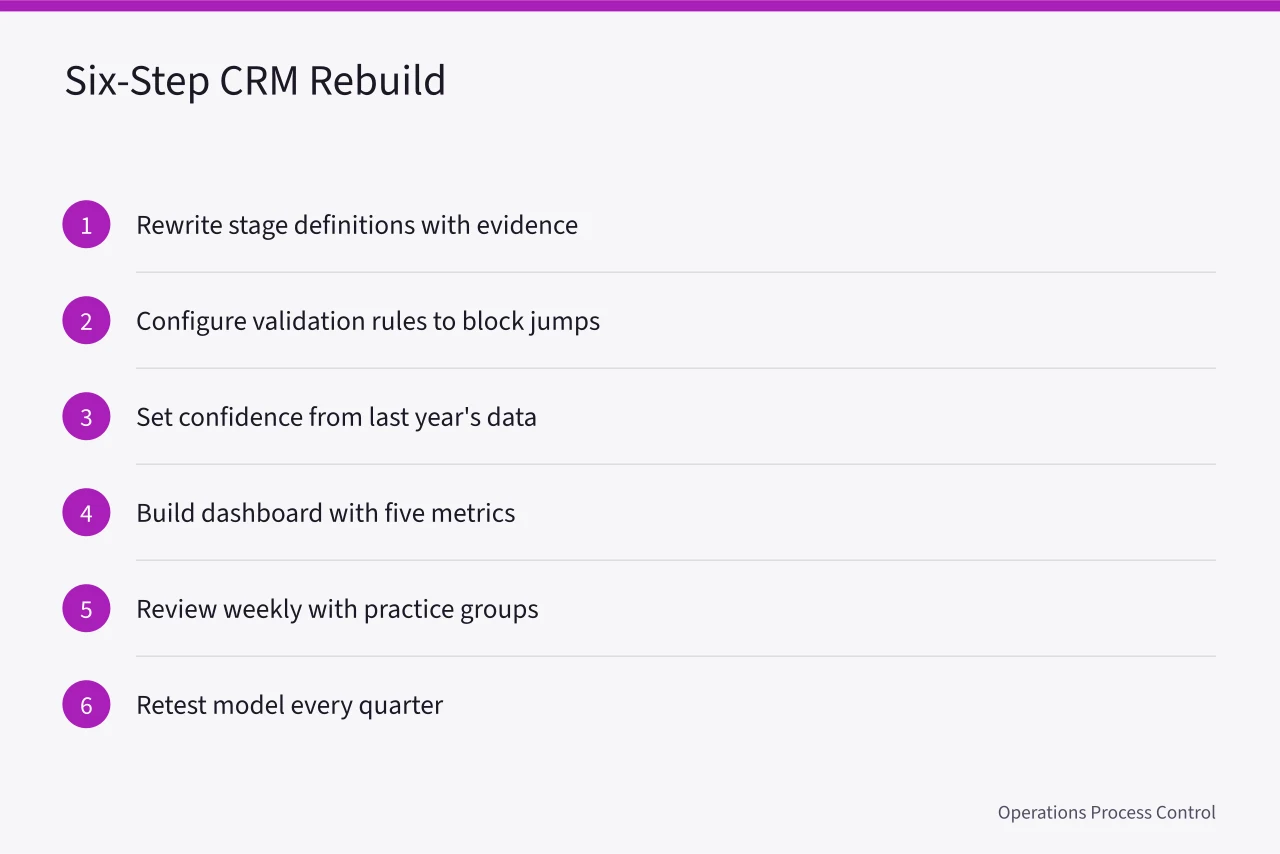
Resist adding fields. Every extra field lowers completion. Seven required fields at the right stages beat thirty optional ones.
Train partners on the why. A partner who understands that stage five confidence is 40 percent because last year proved it will fill the fields.
Document the model on one page: stage definitions, required fields, confidence levels, review cadence. Longer than a page and it will not be used.
Watch for the mistakes that quietly cost you a pipeline: late deal creation, stage inflation, unrecorded losses. Each corrupts the forecast before anyone notices. Start with the parts worth your attention: stages, gates, confidence, review. The rest is optional.
Common questions
How many CRM pipeline stages should a professional services firm use?
Seven or fewer. Each stage must require observable client action, not internal activity. More stages create more places for deals to hide.
Who owns pipeline hygiene rules?
Business development ops owns the rules and the dashboard. Partners own the data in their deals. Without partner accountability, gates become paperwork.
Can a forecast data model work without partner judgment?
No. Stage-based models miss relationship knowledge that partners hold. Run both and investigate large gaps between them.
How often should we retest stage confidence levels?
Quarterly, using the last four quarters of closed and lost work. Adjust confidence when the actual close rate differs by more than 10 points.